R语言绘图如何让多个图像显示于同一图中

2024-04-21 11:01:33
将4张图分屏显示在同一图中,代码如下:
数据:
pie.sales <-c(39,200,42,15,67,276,27,66)
names(pie.sales) <- c("EUL","PES","EFA","EDD","ELDR","EPP","UNE","other")
分屏:
split.screen(c(2,2))
figure 1:
screen(1)
pie(pie.sales,radius = 0.9,main = "Ordinary chart")
figure 2:
screen(2)
pie(pie.sales,radius = 0.9,col = rainbow(8),clock = T,main = "Rainbow colours")
figure 3:
screen(3)
pie(pie.sales,radius = 0.9,clock = T,col = gray(seq(0.4,1.0,length = 8)),main = "Grey colours")
figure 4:
screen(4)
pie(pie.sales,radius = 0.9,density = 10,angle = 15 + 15*1:8,main = "The density of shading lines")
图像个数可以根据需要自定义添加。

扩展资料
R语言是一套完整的数据处理、计算和制图软件系统。其功能包括:数据存储和处理系统;数组运算工具;完整连贯的统计分析工具;优秀的统计制图功能。
参考资料来源:

2024-04-21 07:17:41
不知道你问的是在同一图形中添加点(类似画散点图)还是要把屏幕一分为多。
添加的话,用完plot,添加点用points,添加线用lines。
简单点的应用类似:
plot(X,Y)
points(X,Y1)
这样的感觉。
一分为多的话,用split.screen。
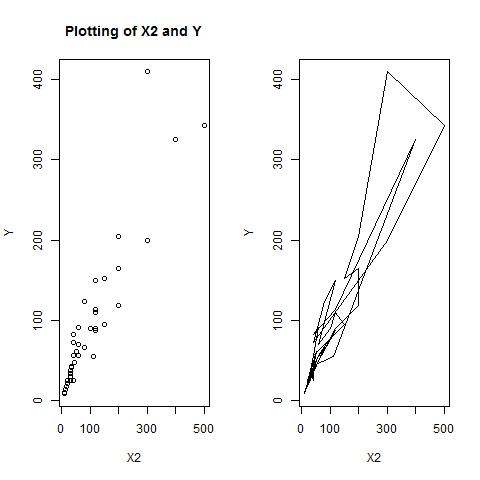
上我自己最近写的代码做个例子:
jpeg(filename="geeseP3.jpeg") #画jpeg图
split.screen(c(1,2)) #分屏幕为左右两边
screen(1) #屏幕1预备输出
plot(X2,Y,type="p",xlab="X2",ylab="Y",main="Plotting of X2 and Y")
screen(2) #屏幕2预备输出
plot(X2,Y,type="l")
dev.off()
画出来的图大概是这个感觉:

不喜欢这个比例的话,也有命令可以调节图片长宽比例。这个略去不提。
另外推荐这个
里面有列举了一些画图用的函数。

2024-04-21 02:35:10
## 数据
pie.sales <-c(39,200,42,15,67,276,27,66)
names(pie.sales) <- c("EUL","PES","EFA","EDD",
"ELDR","EPP","UNE","other")
## 分屏
split.screen(c(2,2))
## figure 1
screen(1)
pie(pie.sales,radius = 0.9,main = "Ordinary chart")
## figure 2
screen(2)
pie(pie.sales,radius = 0.9,col = rainbow(8),
clock = T,main = "Rainbow colours")
## figure 3
screen(3)
pie(pie.sales,radius = 0.9,clock = T,
col = gray(seq(0.4,1.0,length = 8)),
main = "Grey colours")
## figure 4
screen(4)
pie(pie.sales,radius = 0.9,
density = 10,angle = 15 + 15*1:8,
main = "The density of shading lines")
不懂的可以放弃R语言了。。。
热门标签
